Using Standard Deviation
The mean can be used to describe the typical or common value in a data set.
The standard deviation describes a data set by giving the average of the distances from the mean. The greater the range of the data, the greater the standard deviation.
The average (arithmetic mean) supermarket checkout wait time is 4 minutes with a standard deviation of 1 minute 37 seconds (1.6 minutes).
(a) The average wait time in Atlanta, Georgia is 1 standard deviation below the mean. What is the average wait time in Atlanta?
(b) The average wait time in Washington, D.C. is 8 minutes 23 seconds (8.38 minutes). How many standard deviations is Washington’s wait time from the mean?
Solution
(a) Subtract 1 standard deviation from the average wait time.
4:00 – 1:37 = 2:23
The wait time in Atlanta is about 2 minutes 23 seconds.
(b) Subtract the mean from the wait time then divide by the standard deviation.
8.38 – 4:00 = 4.38
\dfrac{4.38}{1.6} ≈ 2.7
The wait time in Washington is about 2.7 standard deviations above the national average.
Normal Distribution
The normal distribution is a way to model data using the standard deviation. It is used to describe data that clusters around the arithmetic mean.
The normal curve is a graphical model of a normal distribution. The graph won’t be shown on the GMAT, but visualizing it lets you quickly calculate the percent of data above or below a given value using the standard deviation.
The area under a normal curve is 100%.
- 50% of the values are above the mean and 50% are below.
- About 68% of the values are within 1 standard deviation of the mean.
- About 95% of the values are within 2 standard deviations of the mean.
- About 99.7% of the values are within 3 standard deviations of the mean.


The average men’s height in the US is 70 inches ± 3 inches.
(a) What percent of men are between 67 and 73 inches tall?
(b) What percent of men are between 64 and 70 inches tall?
(c) What percent of men are taller than 79 inches?
Solution
The symbol ±, “plus or minus,” is sometimes used to give the value of 1 standard deviation, so in this case the standard deviation of heights is 3 inches.
(a) Compare 67 and 73 to the mean, 70. Both are 1 standard deviation from the mean. About 68% of the area is within 1 standard deviation of the mean, so 68% of men are between 67 and 73 inches tall.

(b) Compare 64 and 70 to the mean, 70. 64 is 2 standard deviations below the mean, and 70 is the mean. The area between 2 standard deviations and the mean is about (34 + 13.5)% = 47.5%, so about 48% of men are between 64 and 70 inches tall.

(c) Compare 79 to the mean, 70. It is 3 standard deviations from the mean. The area above 3 standard deviations is about 0.15%. About 15 out of 10,000 men are taller than 79 inches (6 foot 7 inches).

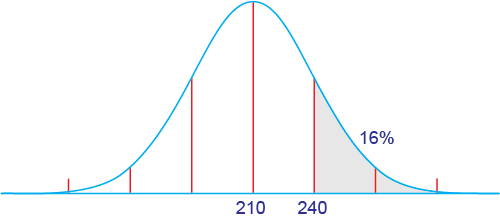
The arithmetic mean of American cholesterol levels is 210, and 16% of the population has a cholesterol level above 240.
(a) Find the standard deviation of cholesterol levels.
(b) The recommended level of cholesterol is less than 200. Estimate the percent of people that need to lower their cholesterol.A. 34% B. 40%
C. 50% D. 60%
E. 84%
Solution
(a) Use the normal curve to find the standard deviation. If 16% of the population is above 240, the normal curve shows that 240 is 1 standard deviation from the mean.
(b) Since the recommended level is below the mean level, more than half need to reduce their cholesterol. The goal of 200 is 10 points below the mean, so it is less than 1 standard deviation from the mean.
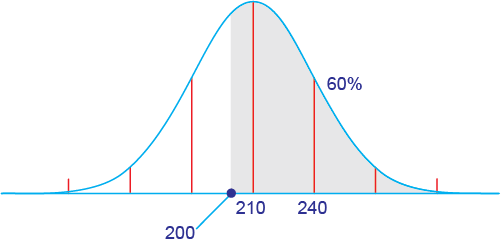
Look at the answer choices. The choice that is more than 50% but less than (50 + 34)% = 84% is 60%.
The correct answer choice is (D).

Find local GMAT classes & schedules using our database of over 150 cities.